Data is king.
Acquiring the data is the first step. You do that in the observation step.
Reflecting on the data and giving you options of how you need to see it is critical. Each administrator wants the ability to view the data the way that they want it delivered. We give the data query results to you based on your customized needs.
iCOR Observation comes with a set of base reports.
- Totals Report: a count of all observations done at each grade level and each content area.
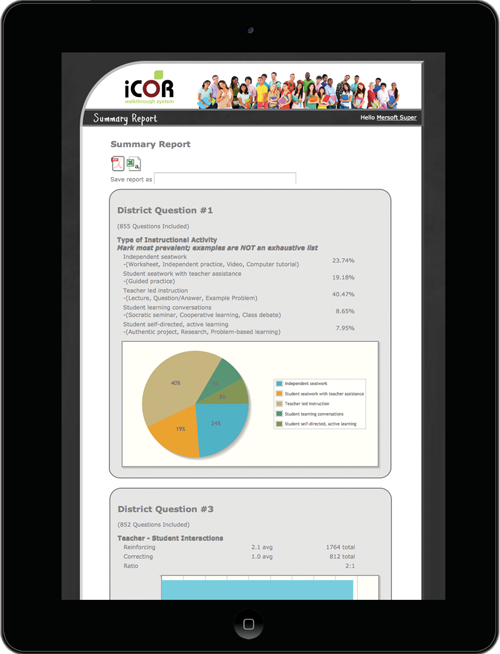
- Summary Report: results of all of the observation questions.
- Customized Summary Report: criteria based report – you choose the criteria for the report based on:
- date range
- observation questions
- grade level
- content area
- teacher
- observer
- Individual Teacher Report: observation questions, comments, and graphs for an individual teacher based on a date range that you select.
- Customized Teacher Report : observation questions, graphs, based on a date range you select for a selected group of teachers.
Each report is customizable. Once you have customized a report, you can save the report criteria to run the report at a later time. See a sample report PDF document.
Why is reporting is a critical component of an observation tool?
What school improvement indicators have you identified? How can you see the results of your professional development for based those school improvement indicators? Do you have observed information as you guide your teachers in professional development? Do you have the ability to easily get that information now? iCOR Observation can provide what you need when you need it.
Learn more about how iCOR can help you solve your reflect and reporting obstacles.
Next steps after you review the data is to recommend improvement measures and professional development. –> Improve